1. What is PPQA?
PPQA (Power Platform QA) is a code-quality tool for Microsoft Power Platform Canvas Apps. You hand it a solution export, and it tells you what is inside, what is broken, and what is dead weight, by reading every Power Fx formula on every control on every screen.
The result is an analysis report: a structured list of findings (unused controls, dead variables, stale references, unreachable screens and so on), each one linked back to the exact file, control, and property where the problem lives.
For makers
Find dead controls and stale references before users do.
For reviewers
Walk through someone else's app with a tree view and an issues panel.
For team leads
Track each app's health over time and enforce house rules with custom checks.
How it works at a glance
2. Core concepts
Three sets of concepts will let you read the rest of this guide comfortably: the solution hierarchy, the analyzer model, and the report.
2.1 Solution hierarchy
A Power Platform solution is a packaged container of one or more apps. PPQA reads the solution and rebuilds the same hierarchy Power Apps Studio shows you:
- Solution — the file you upload (
.zipor.msapp). - App — one Canvas App. A solution can contain several.
- Screen — a top-level page inside an app.
- Component — a reusable control definition (header bars, navs, etc.).
- Control — a button, label, gallery, form, etc. living on a screen or inside a component.
- Property — a value on a control, very often a Power Fx formula (
OnSelect,Visible,Items, …).
2.2 Analyzers, categories, test sets
An analyzer is a single rule that knows how to look for one specific kind of problem (for example "find variables that are written but never read"). PPQA ships with built-in analyzers and lets you add your own.
- Analyzer — one check, with one config, can be toggled on/off.
- Category — a label that groups analyzers in the UI (Dead UI, Dead state, …). Categories are visual only; they don't affect what runs.
- Test set — a named bundle of analyzers you want to run together. When you start an analysis you pick one or more test sets, and PPQA deduplicates and runs the union.
2.3 Reports & issues
Each analysis run produces one report. A report is attached to a specific solution and is timestamped, so you can run the same checks again next week and watch the issue count go down (or up).
A report contains issues. Every issue points at a specific control, property, or formula, and carries a severity, an explanation, and (where possible) a suggested fix. In the explorer these issues show up as small coloured dots that propagate upward through the tree, so you can drill from the file node down to the exact line of Power Fx that triggered it.
3. The basic workflow
- Export your app from Power Apps as a managed or unmanaged solution
.zip(or grab the raw.msapp). - Upload it on the Upload page — drag-and-drop or click to browse.
- Click Analyze on the solutions list and choose what to run: a single analyzer, one or more test sets, or all of them.
- Open the report — or jump straight into the Solution Explorer and let the issue dots guide you to each problem.
- Fix it in Power Apps Studio, re-export, re-upload, re-analyze, and watch the issue count fall.
4. App tour
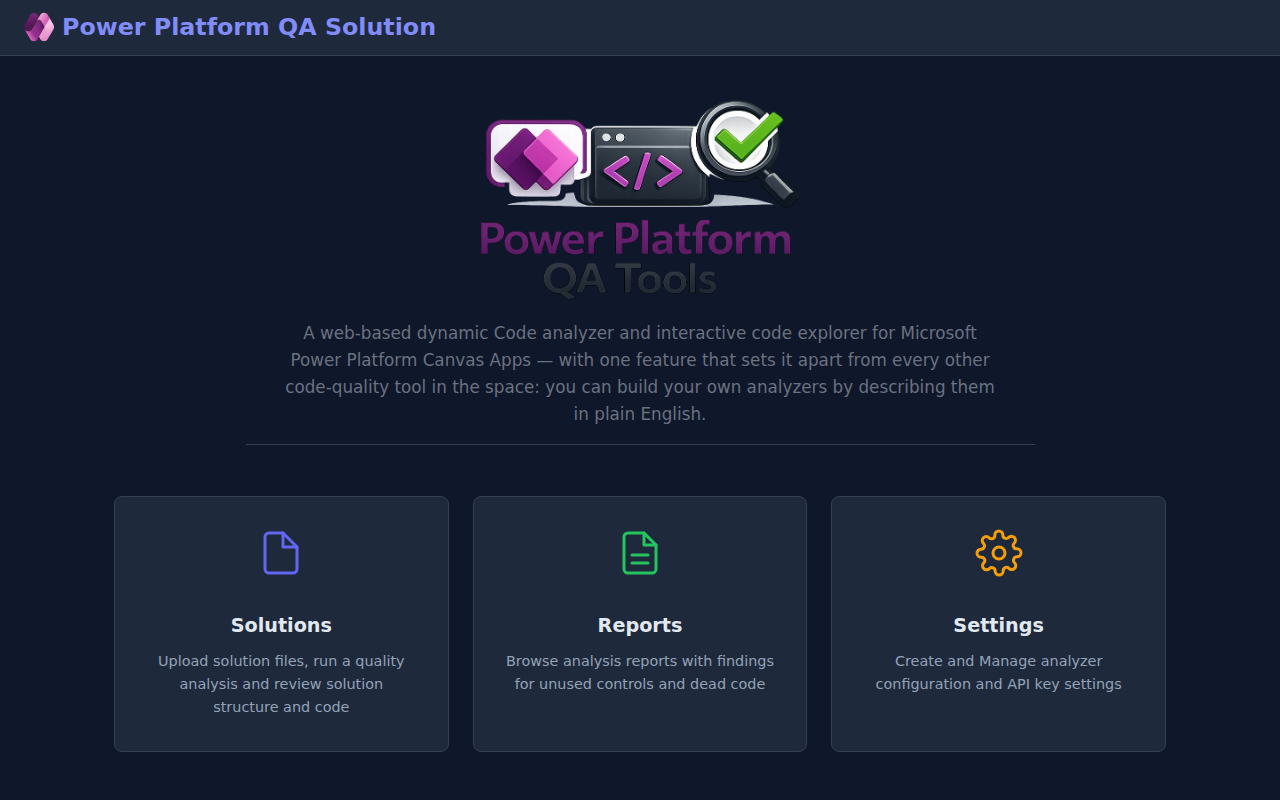
4.1 Home
The home page is your launch pad. Three large cards take you to the three main areas of the app: Solutions, Reports, and Settings. The User Guide link in the top-right of the navbar is always visible — that's how you got here.
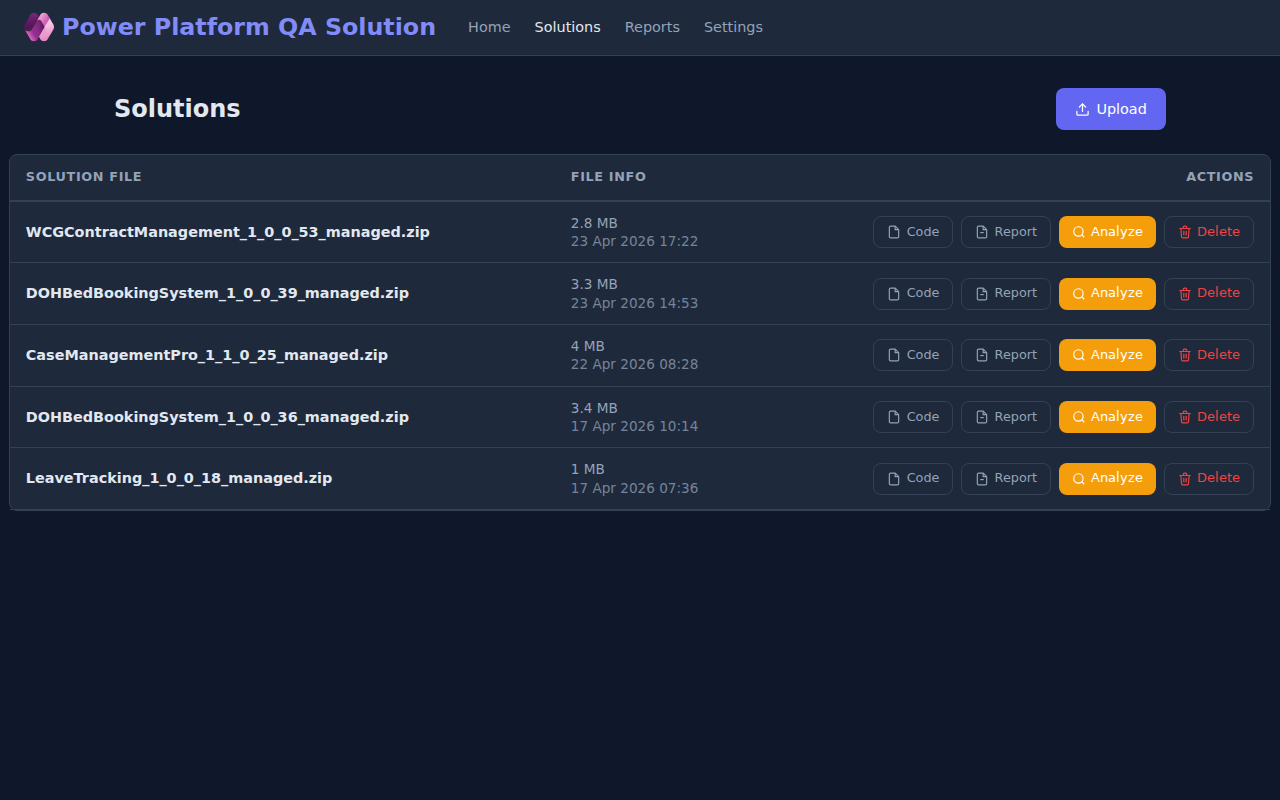
4.2 Solutions
The Solutions page lists every solution file you have uploaded. For each one you get four actions:
| Button | What it does |
|---|---|
| Code | Opens the three-pane Solution Explorer (tree, code, issues). |
| Report | Jumps to the report tab inside the explorer (only shown when at least one analysis has been run). |
| Analyze | Opens the run picker so you can choose a test set or single analyzer and start a new run. |
| Delete | Removes the solution and all its reports. |
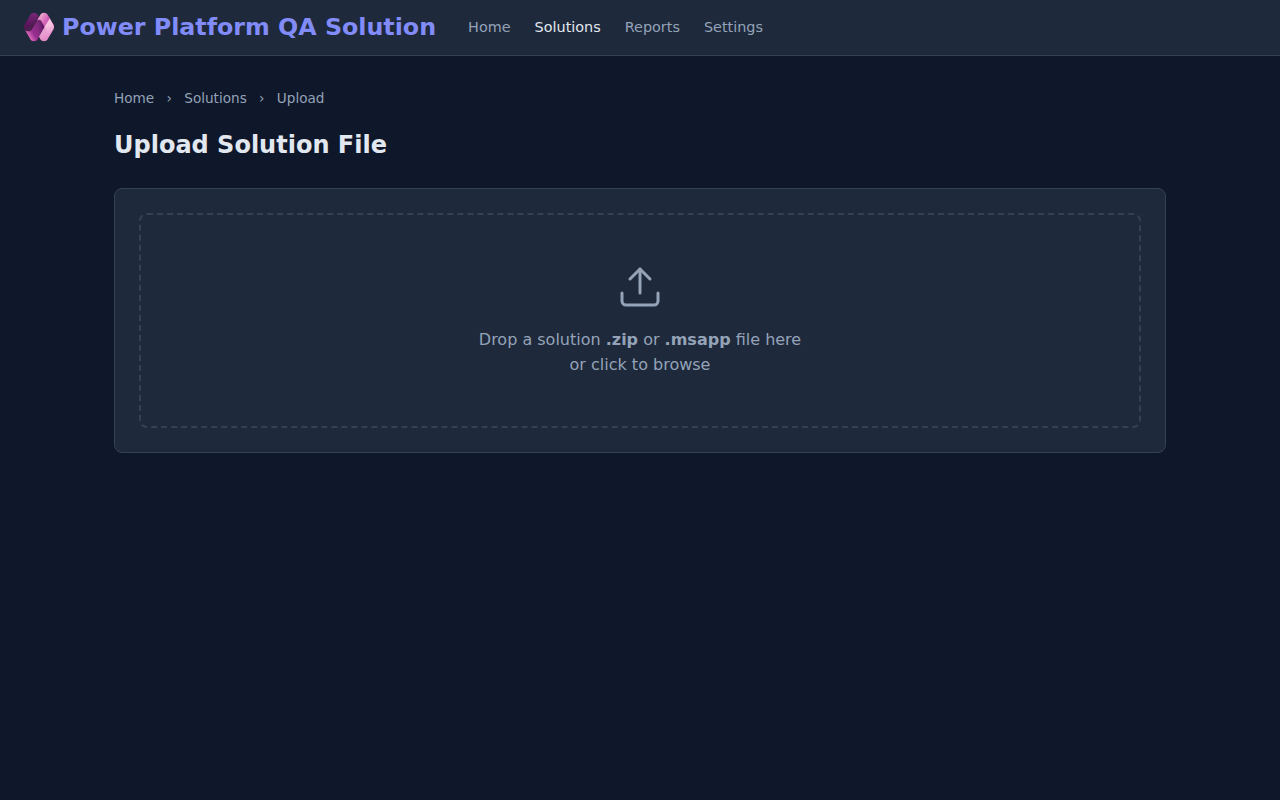
4.3 Upload
Drop a Power Platform solution .zip or a raw
.msapp file into the upload zone, or click it to open a
file picker. The file is stored on the server under a timestamped
name so multiple uploads of the same solution don't overwrite each
other.
4.4 Solution explorer
The explorer is where you spend most of your time. It's a three-pane layout modelled after Power Apps Studio:
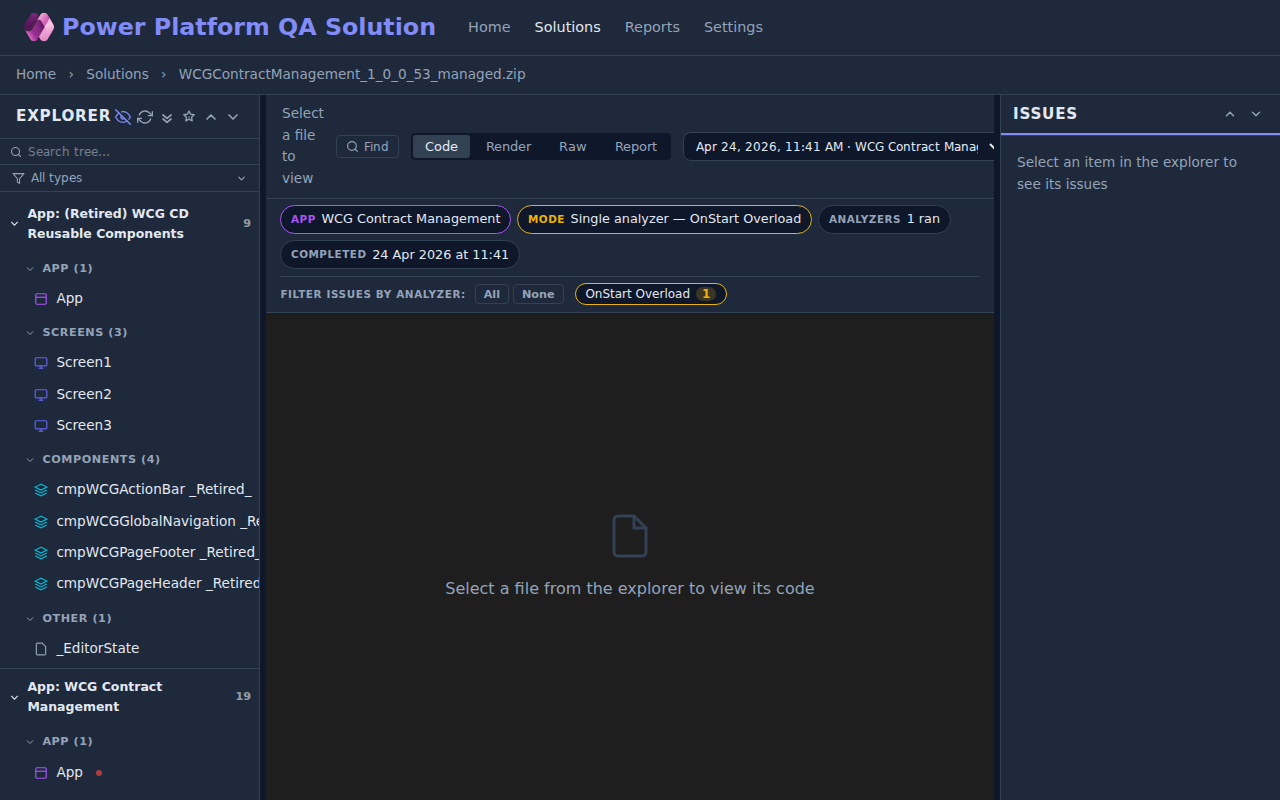
Explorer (left)
- Search box — filters the tree by label while keeping ancestors visible for context.
- Eye toggle — hide or show properties that have no formula.
- Reload — rebuild the tree (useful if you re-uploaded the solution in another tab).
- Expand/Collapse all — toggle the full tree.
- Star — expand only the branches that contain issues.
- ↑ / ↓ — jump between issues across the whole tree.
- Filter by control type — show only Galleries, Buttons, etc.
- Issue dots — coloured dots next to a node mean "there is at least one issue under here". Follow the dots downward to find the offending property.
Code viewer (centre)
- Code tab — the Power Fx for the selected property, syntax-highlighted.
- Render tab — for screen/component nodes, a basic visual preview of the layout.
- Raw tab — the underlying YAML, for the Power Apps internals nerds.
- Report tab — the latest analysis report, rendered inline with filter chips for selecting which analyzer's findings to view.
- Find — opens a find-in-file bar with case-sensitive and regex options.
Issues panel (right)
Whatever you click in the explorer, the issues panel narrows down to issues that affect that node and everything below it. From an issue you can click straight to the offending line in the code viewer.
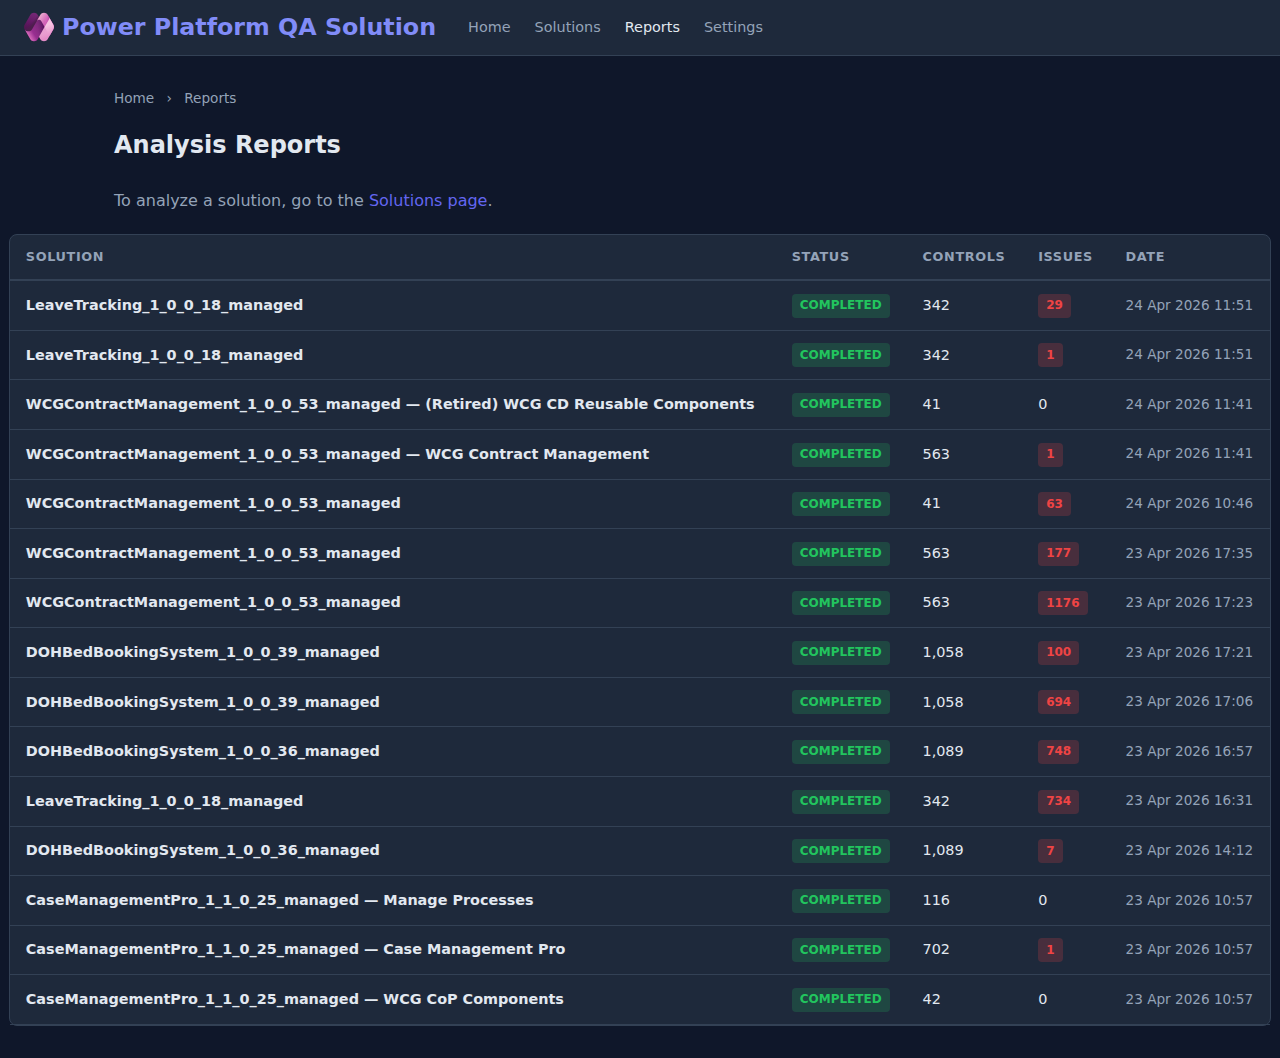
4.5 Reports
The Reports page lists every analysis run, newest first, across every solution. It's the easiest place to compare runs over time: each row shows the solution name, the run status, the total controls, the issue count, and the run timestamp.
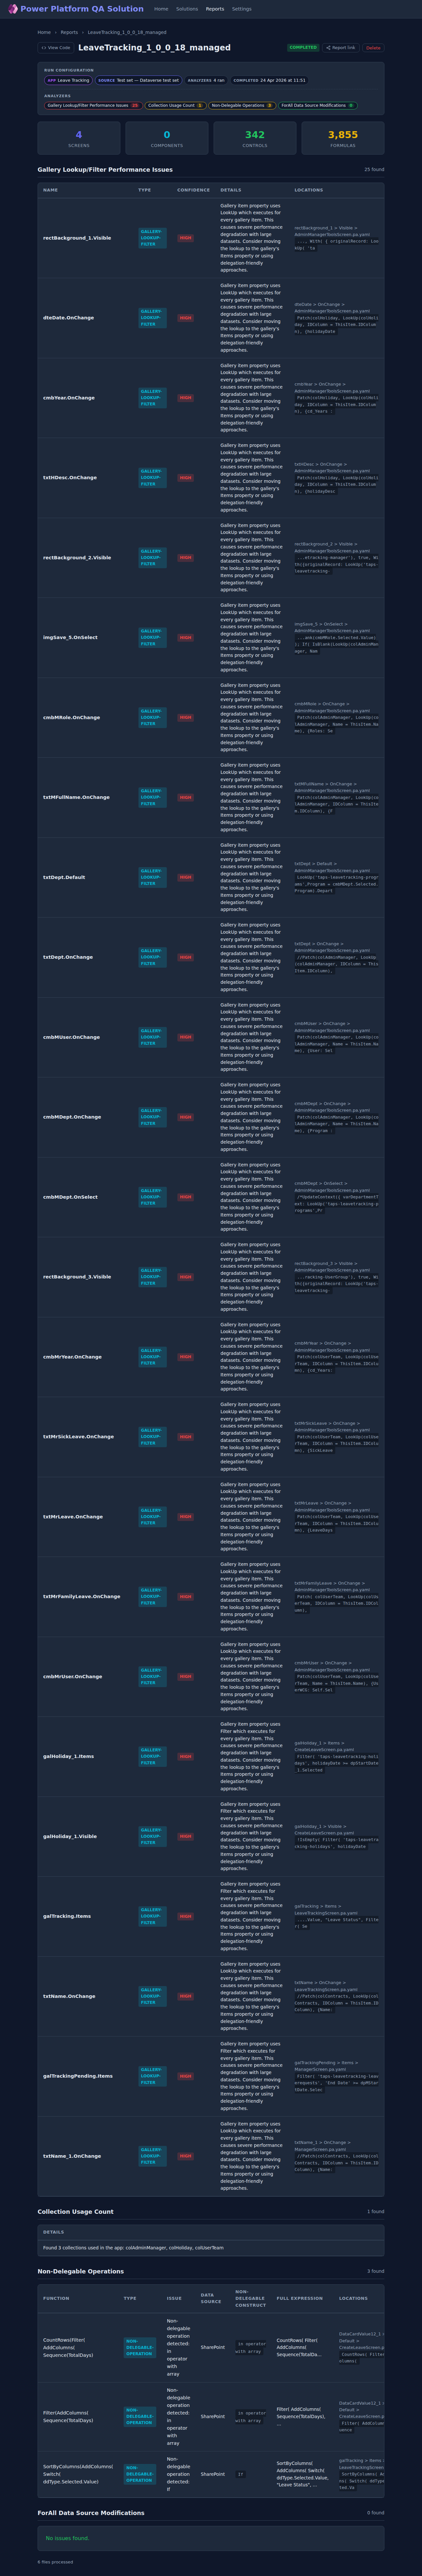
4.6 Report detail
Click any report to see the full breakdown: a summary card, then each analyzer's findings as a sortable, filterable table. Each finding links back to the control in the solution explorer (use the View Code button at the top to jump there). The Report link button copies a shareable URL to the clipboard.
4.7 Settings
Settings is where you tune what runs and how. There are four sub-pages:
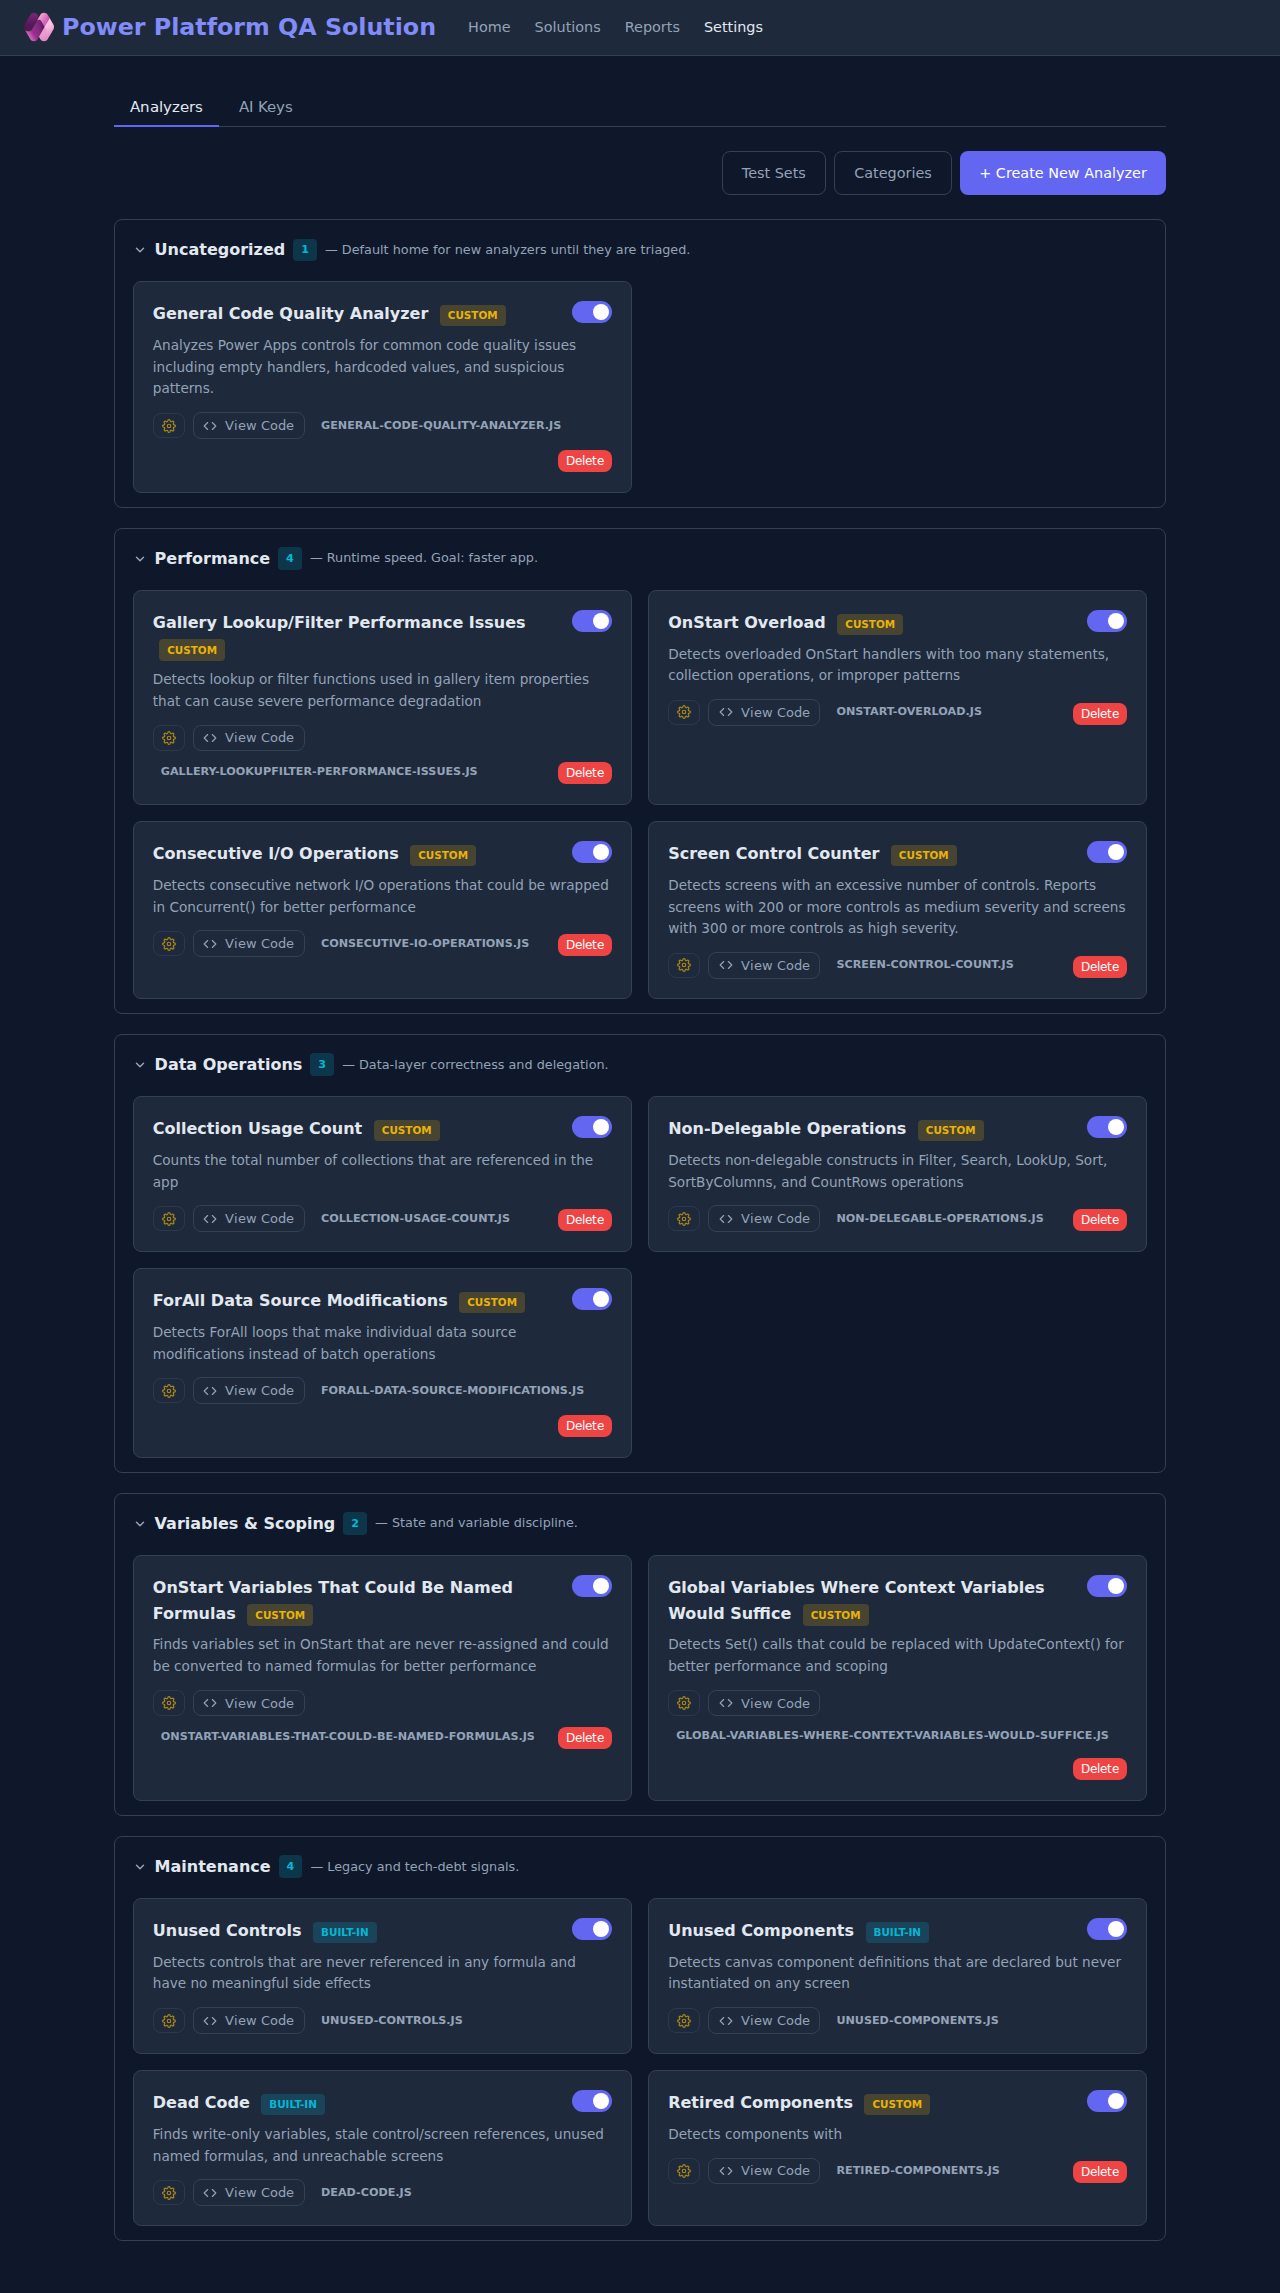
Analyzers
The main settings page. Every analyzer is a card grouped by category. Each card has a toggle (enable/disable for runs), a config button (per-analyzer thresholds and column choices), a View Code button (read or edit the analyzer's JavaScript), and for custom analyzers a Delete button. You can drag a card between categories to re-organise.
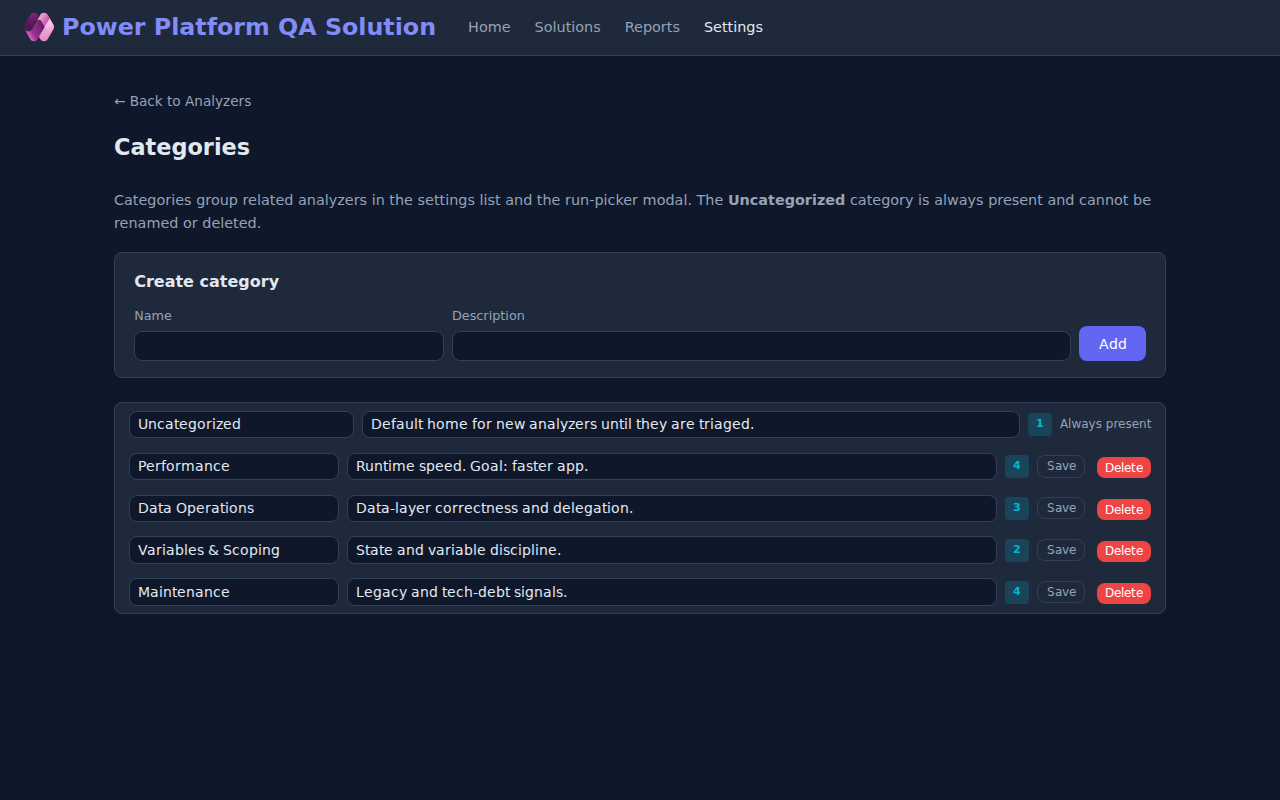
Categories
Manage the labels analyzers are grouped under. The Uncategorized category is fixed; everything else is yours to rename, reorder or delete.
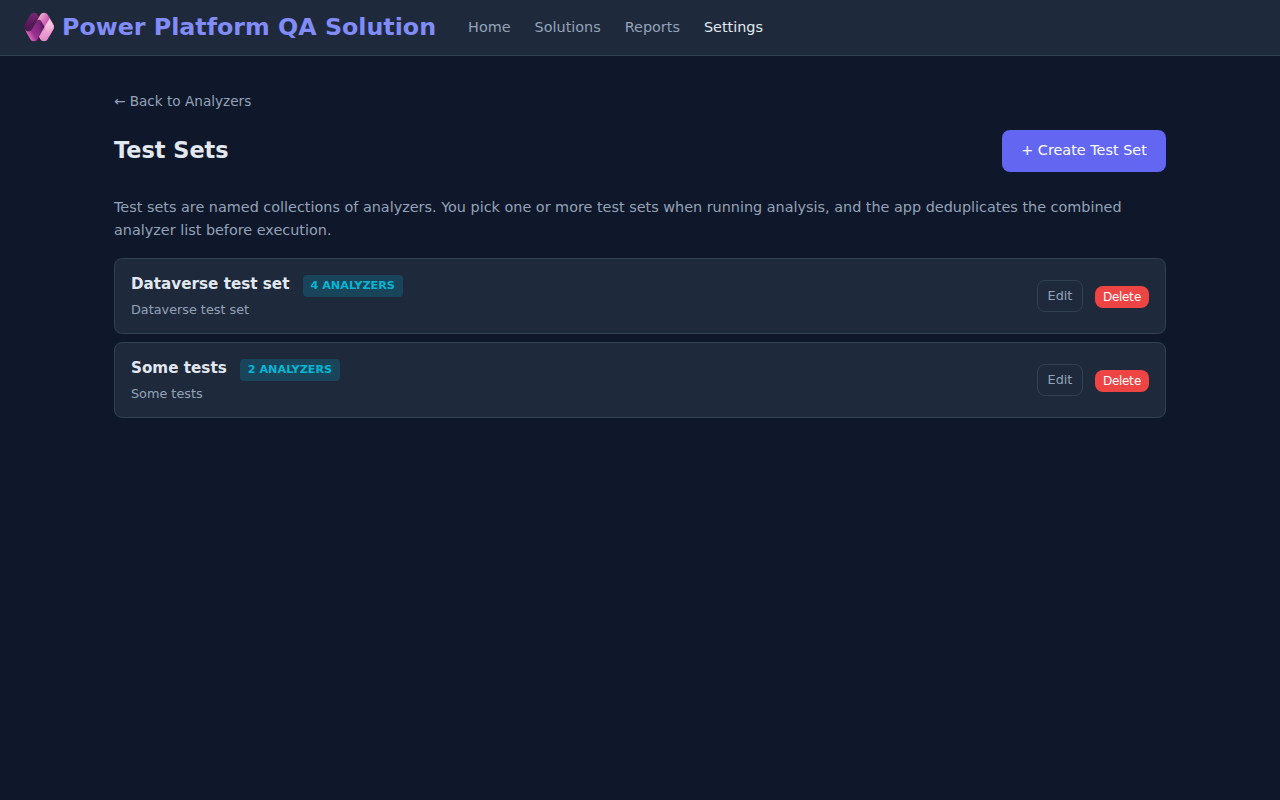
Test sets
A test set is a named bundle of analyzers you want to run as a unit. You might have "Quick check" with two cheap analyzers, and "Pre-release sweep" with everything turned on. When the run picker offers test sets, you can tick more than one and PPQA deduplicates the combined list.
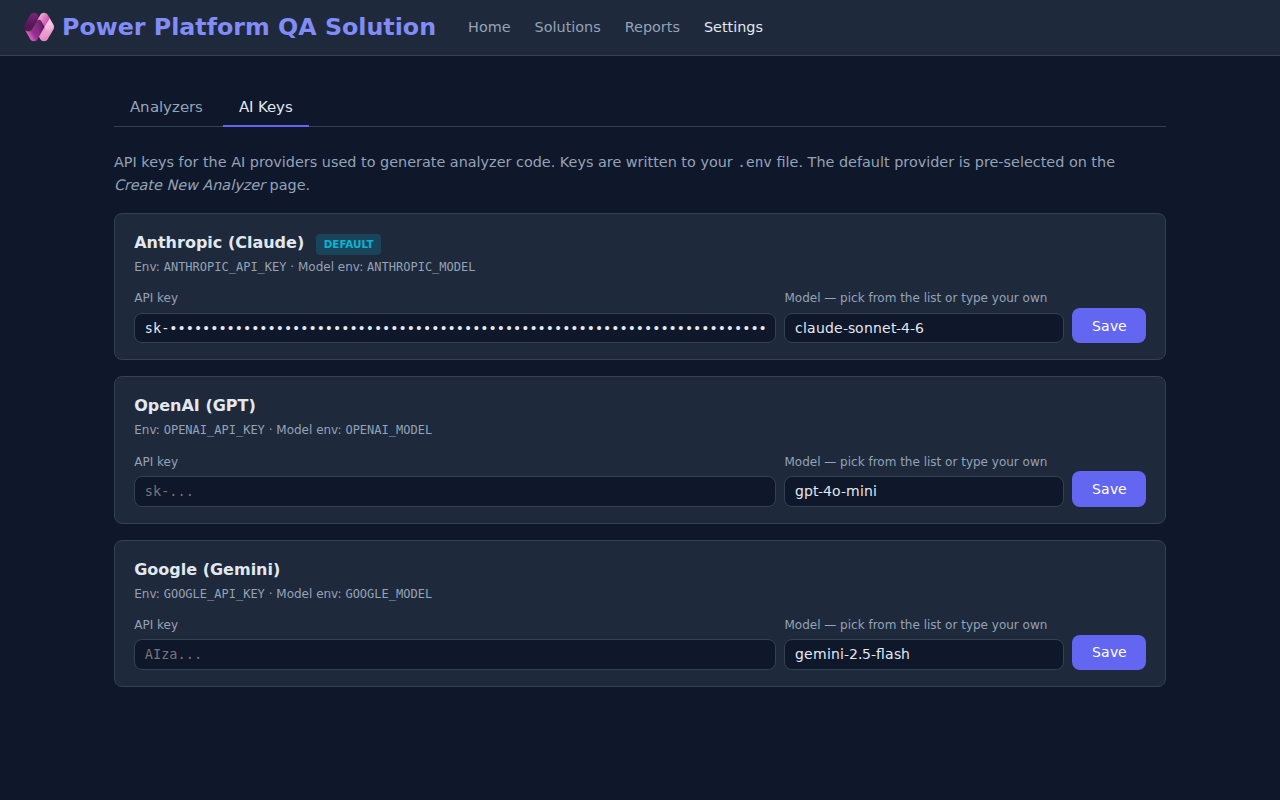
AI keys
On the second tab of the Analyzers page you can enter API keys for
the AI providers used by the analyzer generator. Keys are written
into the project's .env file. The provider you
designate as default is pre-selected on the Create New
Analyzer page.
5. Built-in analyzers
PPQA ships with eight static-analysis checks split across three categories. Each one runs from the same shared reference graph built once per analysis, so adding more checks does not multiply the run time.
| # | Analyzer | Category | What it finds |
|---|---|---|---|
| 1 | Unused control | Dead UI | A control that nothing references and that has no behaviour of its own. |
| 2 | Unused component | Dead UI | A component declared in the solution but never dropped onto a screen. |
| 3 | Write-only variable | Dead state | A variable assigned with Set() but never read. |
| 4 | Write-only collection | Dead state | A collection populated with Collect/ClearCollect but never read. |
| 5 | Stale control reference | Dead refs | A formula referencing a control that no longer exists (renamed/deleted). |
| 6 | Stale screen reference | Dead refs | A Navigate(…) pointing at a screen that doesn't exist. |
| 7 | Unused named formula | Dead refs | An App.Formulas entry no other formula references. |
| 8 | Unreachable screen | Dead refs | A screen the user can never navigate to from the start screen. |
Each finding carries a confidence grade (high, medium,
low) which lets you filter out the noise on first read. The full
detection logic for every check is documented in
docs/analysis-checks-overview.md.
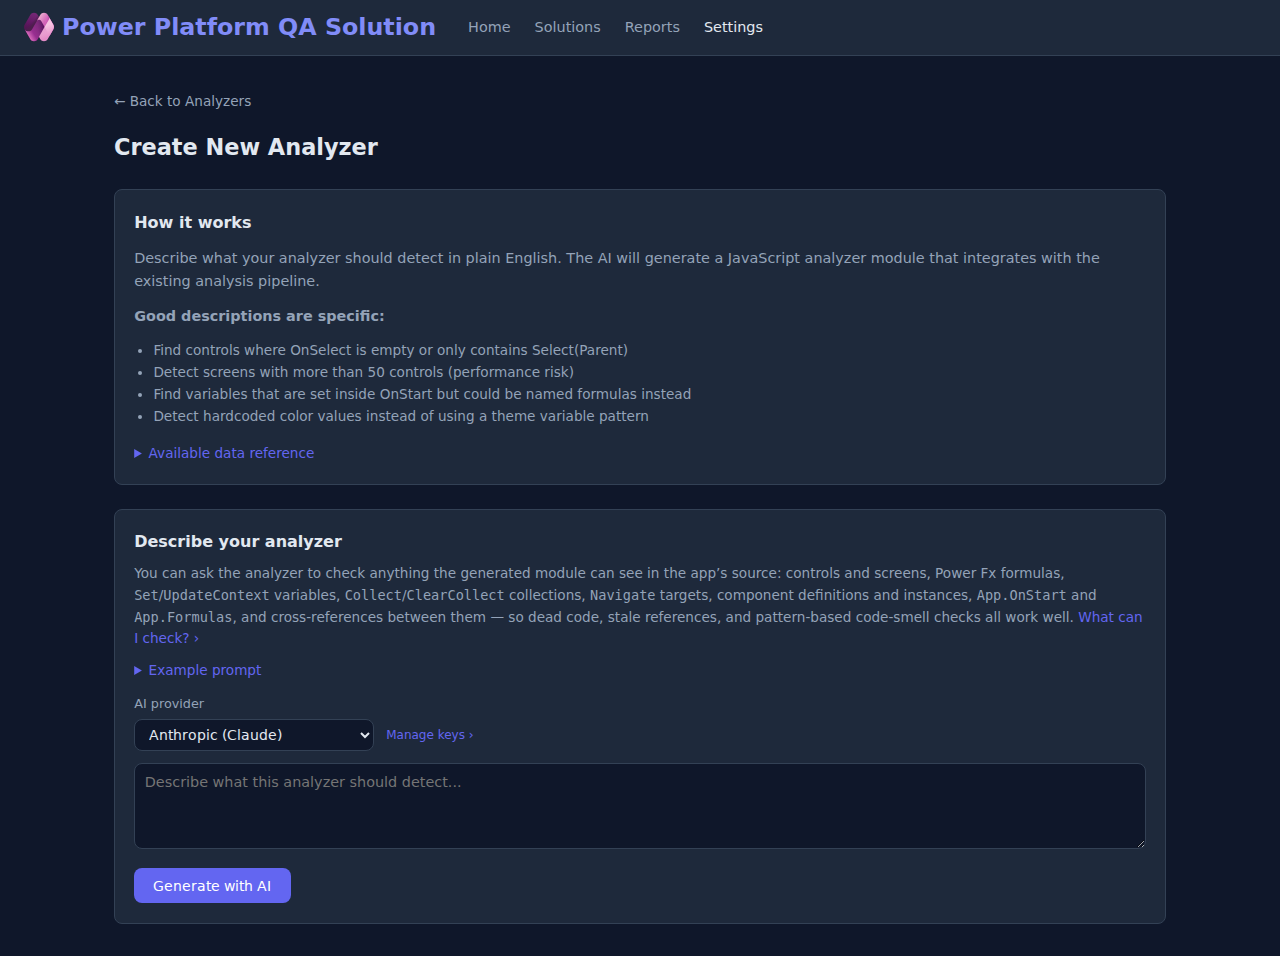
6. Build your own analyzer
The feature that sets PPQA apart: you can describe a check in plain English and have an AI generate the analyzer code for you. The generated analyzer is a normal JavaScript file you can read, edit, and re-run.
- Go to Settings › Analyzers and click + Create New Analyzer.
- Pick an AI provider and model (configured under the AI Keys tab).
- Describe what the analyzer should look for in plain English. Reference the data model and prompt-writing helpers linked from that page.
- Generate, review the code, and save. The new analyzer shows up as a card in the chosen category and is ready to be added to a test set.
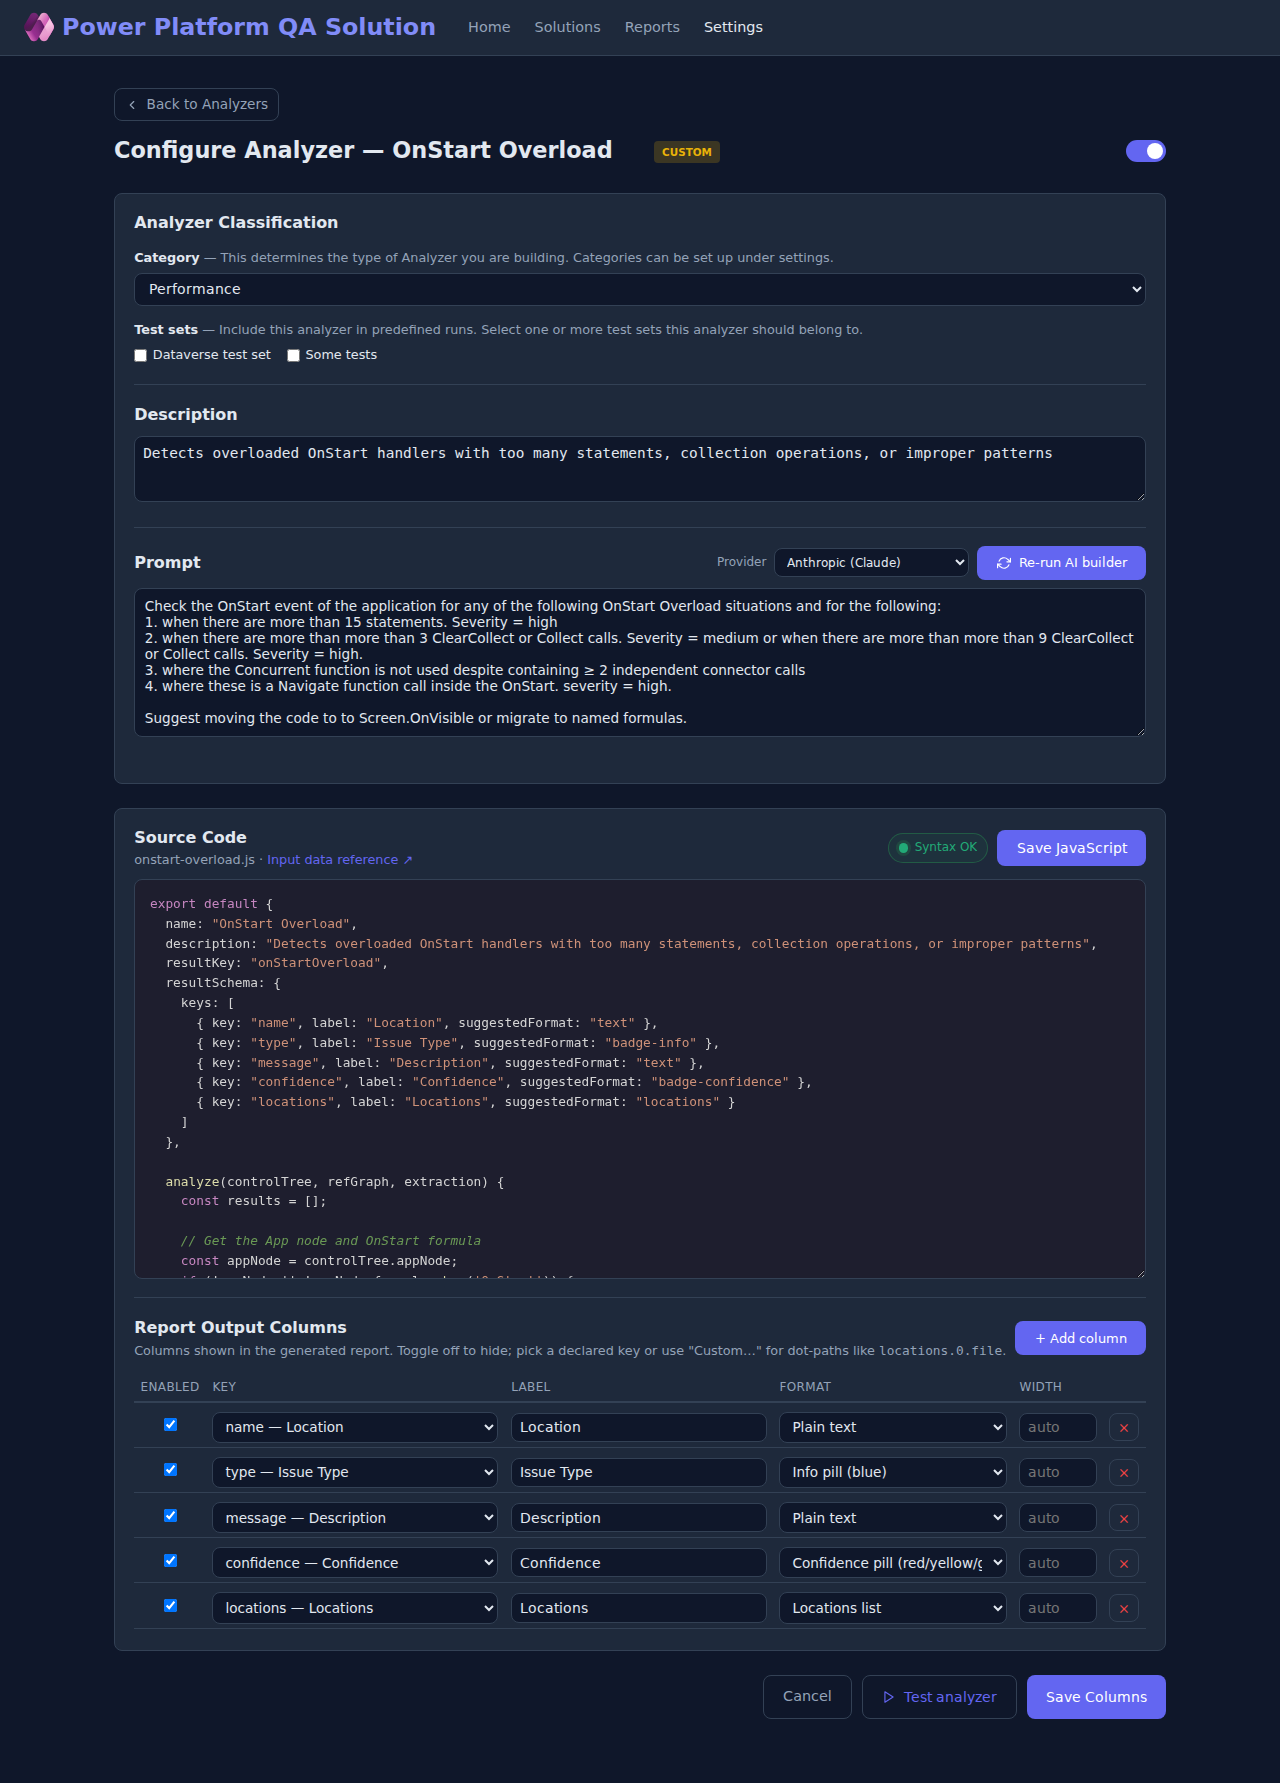
Per-analyzer configuration (thresholds, output columns, severity labels) lives behind the cog icon on each analyzer card.
7. Troubleshooting
The analysis is stuck on "running"
The analyzer runs as a background Node process. Check the
Status column in the Reports list — if it
stays at running for more than a few minutes on a normal
solution, look at the server log. For a CLI-style retry, you can
run node ppqa.js path/to/solution.zip from the
project root and inspect the terminal output directly.
"No issues" after a run, but I expected some
- Make sure the analyzers you expect to fire are actually enabled on the Settings page.
- If you used a test set, check that it includes those analyzers.
- Some checks (e.g. unreachable screens) depend on
App.StartScreen— if your app doesn't define one, the first screen is treated as the start.
The explorer says "Loading..." forever
Open your browser's DevTools network tab and refresh: the explorer
calls /api/solutions/<id>/files and renders once
that responds. A 500 there usually means a corrupt
.msapp — try re-exporting from Power Apps Studio.
I'm asked to sign in
Most pages of the app are open. Only the Environments flow (pulling solutions directly from a Power Platform tenant via the Dataverse API) requires a Microsoft sign-in. Use the upload flow instead if you don't want to sign in.
Need more depth? See the project README and
docs/analysis-checks-overview.md for the full detection
logic of every built-in check.